Sep06
Visualizing Insights
Point: Use visual representations to spur innovative thinking.
Story: Scientific visualization is typically used to communicate data and scientific results, but it can also spark ideas.
Felice Frankel is a scientific photographer who works with scientists across many disciplines — chemistry, biology, oceanography, and so forth. As she sees it, the various disciplines share similar ways to represent data. But, “Unfortunately, you rarely see scientists from different disciplines talking with each other,” she says.
Images can jumpstart communication by creating a common language among different disciplines. What’s more, images can spark new ideas, even if those images are of data which you yourself have been working with for years. Seeing your data presented in a new way can yield new insights. The new depiction gives you a new perspective.
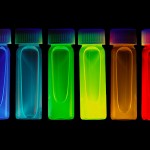
For example, in one project, Frankel was exploring how to show glowing nano-crystals suspended in liquid. She zeroed in on an abstraction  that cropped the top and bottom off each glass cuvette of the nano-crystals. The resulting image removed all visual references to the nano-crystals’ containers. After seeing Frankel’s photograph, Moungi Bawendi, an MIT scientist who’d been working with nano-crystals for years, thought of a potentially new application for them because the new image reminded him of a colored bar code. Bar codes are used as a form of labeling. Seeing the nano-crystals arranged like a bar code gave Bawendi the idea to use them as an alternative to fluorescent organic dyes that scientists currently use for labeling, imaging, and monitoring biological systems, particularly in their response to cancer.
In addition, the visual language of pictures and graphics breaks down the barriers of jargon, discipline-related terminology, and language, making it possible for non-experts or non-native speakers to provide input and collaborate. The visual language “allows us to talk to each other about an image, point out parts that are interesting or beautiful, and ask questions without hesitation,” Frankel says.
Similarly, for David Macaulay, drawing is his way to figure things out, to question, clarify and think about things. Macaulay, bestselling author and illustrator of The Way Things Work and 24 other highly-illustrated books, says: “When you draw something, you really have to look at it. And when you really look at it, you can’t avoid thinking about it.”
Macaulay’s books are primarily images, interspersed with words. “How great is it to have those two languages to work with and pick and choose from?” Macaulay says.
I’m looking forward to meeting Macaulay and Frankel at the Business Innovation Factory’s annual summit on Sept. 19-20, 2012. The summit is almost sold out (it sells out every year), but a few seats remain available as of this posting.
Action
- Look at images from different disciplines to see new ways to present your data or visualize the problems and solutions that you work on.
- Create images with different arrangements, even abstractions, of your data or system to reveal new patterns in your data or ideas.
- Ask people what they see in your images, whether it’s patterns, beauty, or metaphors that can spark new ideas about your area of work.
Sources:
Felice Frankel’s new website: http://visual-strategies.org
Felice Frankel and Angela H. DePace, Visual Strategies, Yale University Press, 2012
Deborah Halber, “Smarter Quantum Dots,” MIT Spectrum, Fall 2011.
Tim McIntire, Felice Frankel: Scientific Discovery Through Visualization
Frankel, Felice. “The Power of the ‘Pretty Picture,’” Nature Materials.
Comments Off on Visualizing InsightsCreativity, How-to, Innovation


