Dec16
Improve Productivity through Data Visualization
Point: Presenting data visually reduces the mental resources we expend to understand a concept, thereby improving our productivity.
Story: Humans are naturally visual creatures. “Fundamentally, our visual system is extremely well built for visual analysis,” says Noah Lliinsky, author of Designing Data Visualizations and Beautiful Visualizations. We’re tuned to spot patterns.
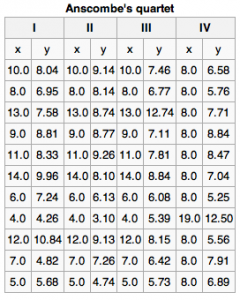
Consider the Anscombe Quartet, created by statistician, Francis Anscombe. First, look at the datasets in Figure 1.1.

Figure 1. The x values are the same for the first three datasets.
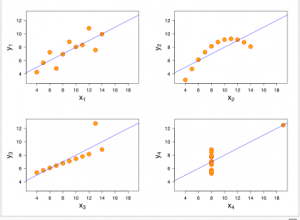
There seems to be little difference between the datasets. But, when graphed out, we suddenly see differences.

Figure 2. Ascombe’s datasets when graphed.
Not only do humans like images, but we’re more efficient thinkers when we use them. A study conducted by Mindlab International at The Sussex Innovation Center investigated how office workers manage existing data using traditional software and how efficient that process is. One of the key findings of the research suggests that when carrying out routine, everyday tasks in the office, if the data is displayed more visually, such as through visual maps, individuals are 17% more productive and need to use 20% fewer mental resources. What’s more, teams collaborating on a joint project use 10% fewer mental resources and are 8% more productive when using visualization tools, reports Mindjet’s Nicola Frazer-Reid.
Why is visual information easier to process? Verbal abilities developed much later on the evolutionary scale than visual ones. “We are well-developed in imagery for quick environmental awareness,” writes Steven Kim in The Essence of Creativity. According to Kim, imagery has two main advantages. First, we can see multiple things in parallel. For example, we can see the body language of four people simultaneously much better than we can track four conversations at a party simultaneously. Second, we can grasp an image’s meaning faster, which accelerates productivity.
Action
- Use visual dashboards to show the status of projects at a glance, such as red/yellow/green indicators
- Use bar graphs and pie charts to show relationships. These visual cues help people quickly grasp the meaning behind numbers.
- Encourage people to sketch out ideas — even very rough drawings help make abstract ideas more tangible and easier for a group to react to and discuss.
Sources:
Source for Fig 1 and 2: http://en.wikipedia.org/wiki/Anscombe’s_quartet#cite_note-Anscombe-1 and Anscombe, F. J. (1973). “Graphs in Statistical Analysis”. American Statistician 27 (1): 17–21. JSTOR 2682899.
http://blog.mindjet.com/2012/05/fact-people-and-teams-work-better-with-visuals-so-what-can-you-do-to-benefit-from-this/


