Improve Productivity through Data Visualization

Point: Presenting data visually reduces the mental resources we expend to understand a concept, thereby improving our productivity.

Story: Humans are naturally visual creatures. “Fundamentally, our visual system is extremely well built for visual analysis,” says Noah Lliinsky, author of Designing Data Visualizations and Beautiful Visualizations. We’re tuned to spot patterns.

Consider the Anscombe Quartet, created by statistician, Francis Anscombe. First, look at the datasets in Figure 1.1.
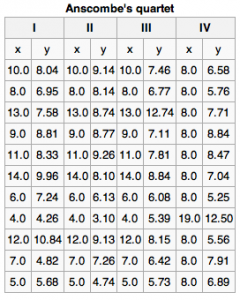

Figure 1. The x values are the same for the first three datasets.
There seems to be little difference between the datasets. But, when graphed out, we suddenly see differences.
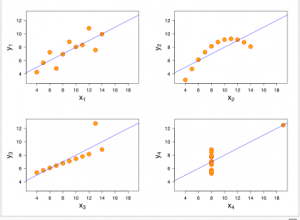

Figure 2. Ascombe’s datasets when graphed.
Not only do humans like images, but we’re more efficient thinkers when we use them.  A study conducted by Mindlab International at The Sussex Innovation Center investigated how office workers manage existing data using traditional software and how efficient that process is. One of the key findings of the research suggests that when carrying out routine, everyday tasks in the office, if the data is displayed more visually, such as through visual maps, individuals are 17% more productive and need to use 20% fewer mental resources. What’s more, teams collaborating on a joint project use 10% fewer mental resources and are 8% more productive when using visualization tools, reports Mindjet’s Nicola Frazer-Reid.

Why is visual information easier to process? Verbal abilities developed much later on the evolutionary scale than visual ones. “We are well-developed in imagery for quick environmental awareness,” writes Steven Kim in The Essence of Creativity.  According to Kim, imagery has two main advantages. First, we can see multiple things in parallel. For example, we can see the body language of four people simultaneously much better than we can track four conversations at a party simultaneously. Second, we can grasp an image’s meaning faster, which accelerates productivity.
Action

  • Use visual dashboards to show the status of projects at a glance, such as red/yellow/green indicators
  • Use bar graphs and pie charts to show relationships. These visual cues help people quickly grasp the meaning behind numbers.
  • Encourage people to sketch out ideas — even very rough drawings help make abstract ideas more tangible and easier for a group to react to and discuss.

Sources:

Source for Fig 1 and 2: http://en.wikipedia.org/wiki/Anscombe’s_quartet#cite_note-Anscombe-1 and Anscombe, F. J. (1973). “Graphs in Statistical Analysis”. American Statistician 27 (1): 17–21. JSTOR 2682899.

http://blog.mindjet.com/2012/05/fact-people-and-teams-work-better-with-visuals-so-what-can-you-do-to-benefit-from-this/

 

1 Comment »How-to, Innovation, Productivity

Innovating by Fusing Reality and Virtual Reality: Joe Pine #3DXForum

Point: Looking at the opposites of everyday constraints yields new opportunities for innovation.

Story: Companies typically see time, space and matter as constraints. That’s not surprising — those three elements define the boundaries of our everyday reality. But what if we  saw them not as constraints but as malleable resources for innovation?

That’s the mind-bending proposition Joe Pine presented at Dassault Systèmes’ 3DEXPERIENCE Forum. Lest you dismiss Pine as a wide-eyed dreamer, recall that his book, Mass Customization, introduced a seemingly impossible paradox when it was released in 1992, but that concept is now so widely implemented that it’s a de rigueur business practice.  The fusion of opposites provides opportunities for innovation.

So how do we utilize time, space and matter for innovation? Pine lays out the steps in his latest book, Infinite Possibility. The way forward, Pine says, is to play with the opposites of time, space and matter, namely no-time, no-space and no-matter.  Whereas time, space and matter constitute our usual realm of Reality, no-time, no-space and no-matter constitute a new realm of pure Virtual Reality

If we fuse reality and virtual reality in various mix-and-match combinations, then we can come up with a host of new products, services and, most importantly, customer experiences.  Using these three dimensions, Pine details an eight-realm new universe (“multiverse”) that pairs eight combinations of time vs. no-time, space vs. no-space, matter vs. no-matter.

Let’s start by exploring a realm that is only one step removed from reality, what Pine calls “Augmented Reality.”  Compared to reality, which has time, space and matter, Augmented Reality has time, space and no-matter.  The “no-matter” condition refers to the information that is overlaid onto reality.

Here’s an example: say you’re driving down the street in a city unfamiliar to you. You are in a real space and in a real time. But, you can use a device to overlay information (“no-matter”) onto that current reality. That is, you can use a GPS navigation aid to show you where the nearest bakery is.  The GPS gives you data (“no-matter”) that you can’t see yet in the real world (a bakery around the corner a few blocks away). With that information, your reality is augmented — you can navigate to the bakery and get the cupcake you crave. 

Companies can apply these concepts to new product development. For example, what new products or enhanced experiences could you create in Augmented Reality? Dassault Systemes’ CEO Bernard Charles demonstrated one such product, 3DParis.  With this app, you can stroll the streets of Paris and see an overlay of your current street in olden times — 2000 years of Parisian history showing you how the street you’re walking down looked, say during the time of the French Revolution in 1789.

That’s a playful consumer app; the same principles apply to hardcore business operations, such as airplane repair.  Consider an app that lets mechanics point an iPhone at a distant airplane on the tarmac and get an immediate overlay of the maintenance and repairs that need to be done for that specific plane. 


Action

  • Look for ways to virtualize your product, service, or business along one or more of the three dimensions of time, space and matter.  Break the constraints on the “when,” “where,” and “what.”
  • Consider ways to replace or enhance the matter of a product, service, or business with data, graphics, and manipulated versions of reality

1 Comment »Growth, Innovation, New Product Development, Opportunity, Social Media, Software tool

CVS and Ford: Putting Designers in Customers’ Shoes – literally

Point: To design better for customers, put yourself in their shoes.

Story:  What’s it like to drive a car if you can’t turn you head easily to look over your shoulder? Or to shop, if bending over hurts and the product you want is on the bottom shelf?

That’s what older drivers feel, and every minute in the US, one person turns 66. In seven years, the US will have 55 million people over age 65 — a big market.

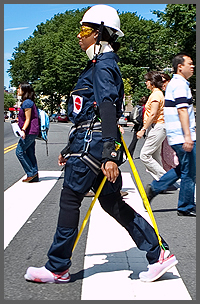
To better design for the needs of this market, companies like pharmacy chain CVS are putting themselves in the shoes of aging customers with AGNES. AGNES stands for “Age Gain Now Empathy System.” Developed by the MIT AgeLab, AGNES is a specially-designed jumpsuit that mimics what it feels like to be in your mid-70s. The suit can be be worn by designers, product developers, architects and planners to experience firsthand the physical challenges associated with aging. For example, bungee cords anchored to the helmet and hip restrict movement and rotation of the spine, and elastic bands from hit to wrist reduce shoulder mobility.

CVS will be making store design changes based on learnings from the suit. For example, they’ll be putting carpeting in the stores to reduce slick-floor slipping, and they’ll adjust the height of checkout counters to require less bending and lifting.

Similarly, Ford Motor’s engineers use a similar suit (they call it the “Third Age Suit”) to experience driving with restricted movement and dexterity in hands, knees, neck and even eyesight (goggles simulate cataracts).  Ford also has a bulbous weighted “empathy belt” that simulates the physical effects of pregnancy.  All of these inventions help give designers a better sense of the consumer’s experience of the company’s products and services.

The result: not only will product designers develop better products for the elderly, but their innovations — like Ford’s hands-free automatic parallel-parking system — appeal to consumers of all ages. Simplicity, ease and comfort attract customers of any age.

Action:

  • Create tools or prostheses that simulate the customer’s experience of the product or service
  • Test products and services for ergonomics for a wide range of customers (especially the growing population of those over 65)
  • Look for win-win design solutions that improve usability for everyone.


Sources:

MIT AgeLab: AGNES (Age Gain Now Empathy System)http://agelab.mit.edu/agnes-age-gain-now-empathy-system

Future Demographics – The Silver Book: http://www.silverbook.org/browse.php?id=57

Interview with Dr. Joseph Coughlin on AGNES and the AgeLab: http://web.mit.edu/newsoffice/2009/coughlinqaa-0414.html

In An Aging Nation, Making Stores Senior-Friendly
http://www.npr.org/2011/05/10/135773106/in-an-aging-nation-making-stores-senior-friendly

In a Graying Population, Business Opportunity
http://www.nytimes.com/2011/02/06/business/06aging.html?pagewanted=all&_r=0
A Profile of Older Americans: 2011 – Administration on Aginghttp://www.aoa.gov/aoaroot/aging_statistics/Profile/2011/docs/2011profile.pdf

Comments Off on CVS and Ford: Putting Designers in Customers’ Shoes – literallyCase study, Customers, How-to, Innovation, New Product Development

« Prev - Next »