Mar11
Measuring the Intangible
Point: Use publicly-available photos to shed light on tourist delight
Story: Barcelona invested heavily to revamp the city to attract tourists for the Olympics and beyond. What places did tourists visit? What did they see and like? What did they tell their friends about? The city can measure tourism dollars, but the intangible experience of pleasure is harder to measure.
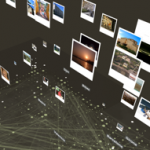
The Los Ojos Del Mundo (The World’s Eyes) project helps provide some answers. The project looks at the publicly-available photos on Flickr that people post of Spain. Using data mining and visualization techniques, team members from MIT’s SENSEable city lab plotted photos onto a map of Spain. The concentration of photos shows which places tourists deem most photoworthy and want to share with their friends.
Action: Consider what data is publicly available on your product, brand, or city. Flickr, Twitter and blogs are all rich sources of user-generated photos, opinions or reviews. Analyze which features or aspects of your product are displayed or mentioned. This data helps reveal how customers portray, experience or feel about your product.
For more information: See Los ojos del mundo (the world’s eyes) for full information on the project as well as additional photos, courtesy of http://senseable.mit.edu/worldseyes/press.html
Girardin, F., Calabrese, F., Dal Fiore, F., Ratti, C., and Blat, J. (2008). Digital footprinting: Uncovering tourists with user-generated content. IEEE Pervasive Computing, 7(4):36-43.
Girardin, F., Dal Fiore, F., Ratti, C., and Blat, J. (2008). Leveraging explicitly disclosed location information to understand tourist dynamics: A case study. Journal of Location-Based Services, 2, 1, 41-54.
For more on creative design and the field of information visualization: Information Aesthetics
6 Comments »Customers, How-to, Innovation, Metrics
6 Responses to “Measuring the Intangible”


David Svet Mar 11th 2009 at 08:24 am 1
Andrea, this is fantastic! You’re right, usable, meaningful data is available all around us. The array of tools to put it to good use are astounding. It’s just a matter of thinking through what the data really means, recording it in a retrievable manner, and using to connect with people on a personal level. We have a new blog post on http://www.SPURspectives.com that talks about the person needed to manage the data for a NPO: http://spurspectives.com/every-nonprofit-needs-a-data-guru-gatekeeper/
Thanks!
David Svet
Andrea Meyer Mar 11th 2009 at 08:36 am 2
Excellent takeaway, Dave, and what a great application to nonprofit organizations! I especially like the advice you give [at http://spurspectives.com/every-nonprofit-needs-a-data-guru-gatekeeper/ ] about having a Data Guru who doesn’t just collect the data but is equally excited about discovering what the data can do.
Rosemary Carstens Mar 11th 2009 at 06:29 pm 3
One of the most exciting things about learning something new is reviewing your old ideas and concepts in light of it, making new connections, and seeing how entirely NEW products, materials, and services can result. I love that Barcelona used such an innovative concept to “map” the city’s emotional impact on tourists!
Stephanie Chasteen Mar 13th 2009 at 10:04 pm 4
This is a great example of enhanced mapping – taking some intereresting available public data to find out someone more about an area. There was a wonderful project at the Exploratorium called “Cabspotting” – http://cabspotting.org/ – that traced the routes that taxis took throughout San Francisco.
They write:
“Cabspotting traces San Francisco’s taxi cabs as they travel throughout the Bay Area. The patterns traced by each cab create a living and always-changing map of city life. This map hints at economic, social, and cultural trends that are otherwise invisible. The Exploratorium has invited artists and researchers to use this information to reveal these “Invisible Dynamics.””
Check it out, it’s really interesting.
sciencegeekgirl » Cabspotting: San Francisco cab tracker reveals the life of the city Mar 13th 2009 at 10:22 pm 5
[…] recent post over at Working Knowledge (Measuring the Intangible) about how Barcelona plotted Flickr photos on a map of Spain to reveal favorite tourist locations reminded me about a really neat site at the Exploratorium.
Andrea Meyer Mar 16th 2009 at 02:46 pm 6
Thanks for sharing the cabspotting link, Stephanie. That’s a great example of how we can gain new insights by looking at publicly-available data in new ways. The fact that the Exploratorium is making this data available to everyone – and with interactive twists like Fly Cab — makes it all the more powerful because anyone can view and interact with the data to find patterns. Putting tools and data into everyone’s hands means that lots of new insights will be possible!